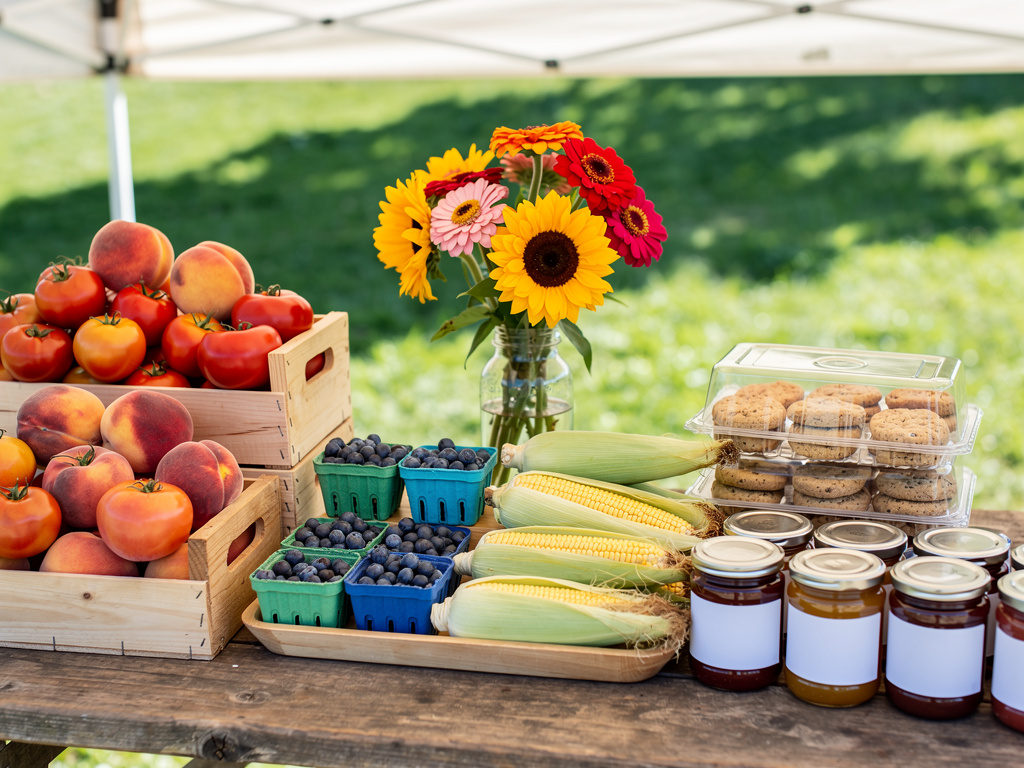


The short version: No public source ranks farmers market products by sales, but in a national survey run in 2023 and published in 2025, 92% of farmers market goers said they commonly buy fruits and vegetables, followed by packaged products like jam (39%), bakery products (38%) and eggs (25%), and 71% go at least once a month in summer against 45% in fall. So lead your summer booth with what is in season that week (strawberries and cherries early, then blueberries, peaches, tomatoes and sweet corn) and add heat-tolerant extras like unfrosted cookies, bread, jam and honey, plus cut flowers kept in water and shade. Leave buttercream, chocolate and cream cheese frosting home on hot days, because butter starts to soften around 68°F and is mostly melted by about 95°F.
Checked September 30, 2026: the national survey by Witzling, Shaw and Wolnik in the Journal of Agriculture, Food Systems, and Community Development (2025), Virginia's farmers market price report dated August 31, 2026, seasonality charts from Georgia, Michigan, New Jersey and Washington, USDA's food safety page, a pull of Homegrown's catalog, and the pricing pages of Homegrown, Square and Etsy. Harvest dates move a week or two each year, and cottage food rules differ by state, so verify your state's current rules. Homegrown customers create an account to place their first order, and Homegrown has no drops or countdown release feature.
Fresh produce is what nearly every farmers market shopper says they commonly buy, and jams, baked goods and cut flowers are among the extras many of them also buy. Honey fits alongside them on a summer table. But the real question for vendors is not just what sells. It is what sells in the heat. Products that hold up in spring and fall (buttercream cakes, chocolate, fudge) become liabilities in June through August. Adjust your lineup to match the season, both in flavor and in heat tolerance.
For the rest of the year, our farmers market season calendar shows what to plan for month by month.
A national survey of 5,141 U.S. adults found that 80% of the U.S. adults it surveyed visit a farmers market at least once a year, and about 42% are frequent visitors who go six or more times. Summer is when that traffic peaks: 71% of market goers went monthly or more in summer, against 45% in fall. This guide breaks down what shoppers commonly buy, what is in season in those three months, what it sells for, and what to leave home, so you can stock your booth with the right products.
Fruits and vegetables are what nearly every shopper buys: 92% of farmers market goers in a national survey fielded in August 2023 (published in 2025) said they commonly buy produce. The next tier is much smaller. About 39% commonly buy packaged products like jams, syrups and sauces, 38% buy bakery items and 25% buy eggs.
That survey is the best public answer to "what are the most popular farmers market items." Researchers at the University of Wisconsin-Madison and the Farmers Market Coalition asked 5,141 U.S. adults in a nearly nationally representative sample, run by NORC at the University of Chicago, and reported the answers of the 4,128 who attend markets. Each person could pick every type of product they commonly buy.
What farmers market goers say they commonly buy
Source: Witzling, Shaw and Wolnik, "U.S. farmers market attendance and experiences," Journal of Agriculture, Food Systems, and Community Development 14(1), 2025, the 4,128 respondents who attend farmers markets. Shoppers could pick more than one type, and the question covered markets in general, not summer alone. Bar widths are each share divided by 92.1%. Read September 30, 2026.
Three things in that survey matter for a summer vendor:
The same survey asked about ordering ahead. About 17% of market goers were quite or very interested in preordering online and picking up at the market. That is a small share of all shoppers, and those are the shoppers most likely to use an order-ahead page.
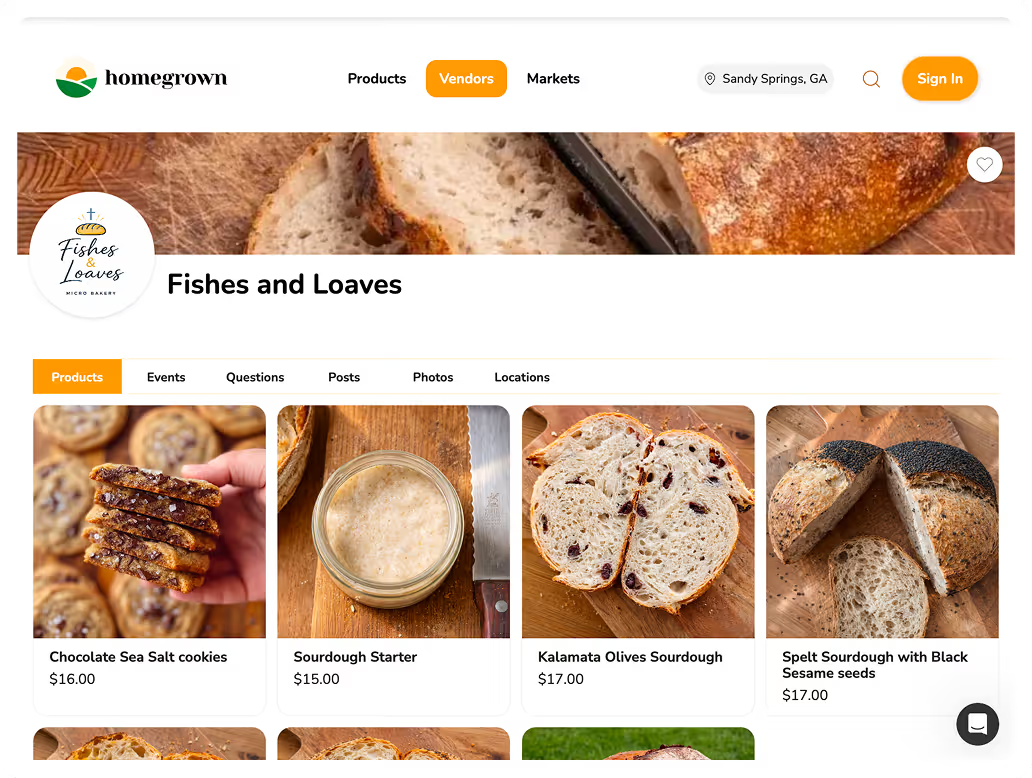
Selling at markets? Let customers order ahead online. You can set up a store that takes orders and payments online in about 15 minutes. Set up a Homegrown storefront for $10 a month billed yearly with 0% commission, plus 2.9% + $0.30 card processing on each order, or compare the best platforms to sell food from home first.
If you are deciding what to sell for the first time, our guide on how to decide what to sell at your first farmers market walks through the full decision process.
No public source ranks farmers market products by sales, and no published source ranks or tracks sales by product across U.S. farmers markets, so any "top 15 best-selling products" list is someone's opinion. What you can find are three honest measures: what shoppers say they buy, what vendors of each type actually sold in studies that collected their receipts, and what vendors list for sale.
Here is what each one shows, and what it does not:
Slide the table left to compare the three ways to measure what sells.
| Measure | What it found | What it does not tell you |
|---|---|---|
| What shoppers say they buy (national survey, run 2023) | 92% commonly buy produce; 39% packaged products like jam; 38% bakery; 25% eggs; 17% cut flowers | How much they spend on each, or which single item sells most |
| What vendors sold (five rural Oregon markets, 2019 to 2021) | Farm product vendors sold about 107% more per market day than craft and art vendors, and value-added food vendors about 85% more, after controlling for other factors | Results for a big city market, or for one product inside a category |
| What sells by time of day (22 New York markets, 2021) | Across more than 26,000 sales by 10 livestock farms, the largest single purchases came at the start of the market, and spending per sale fell hour by hour after | Whether the same holds for a bakery or a produce table |
| What vendors list (Homegrown catalog, September 30, 2026) | Bakery was 1,404 of 2,773 listings (51%); among the rest, jams and other pantry products 299; ready-to-eat food 187; health and wellness 143; vegetables 129; meat and poultry 115; plants and flowers 105 | Sales. These are listings in categories vendors chose themselves |
Sources: Witzling, Shaw and Wolnik (2025); Rahe, Tsay and Low, "Vendor Types, Attendance, Experience and Sales 2019-2021," Agribusiness (2025), 9,371 market-day sales reports from 399 vendors; Rigotti, LeRoux and Schmit, Journal of the Agricultural and Applied Economics Association (2023), as summarized by the Cornell Chronicle on December 19, 2023; Homegrown catalog pull of September 30, 2026. All read September 30, 2026.
In this guide, "sells best" means what the most shoppers buy, not the most revenue or profit per product. For profit, see the cost math in our most profitable foods guide. Put together, the pattern is clear enough to act on. In the Oregon study, farm and value-added food vendors outsold craft vendors. Shoppers come for produce and add one or two extras. And in the one study that timed sales, at 10 livestock farms, shoppers spent the most per sale in the first hour of the market.
Lists that rank "the 15 best-selling farmers market products" or claim a product is the "number one" product are not built on sales data, because none is published. Treat them as ideas to test, not facts. The only sales numbers that count for your booth are your own, so write down what you sold every market day.
Fresh produce is the category the most market goers commonly buy, and baked goods, preserved foods and cut flowers are common extras, with honey a natural fit for a summer booth. Summer is also when the most people come: 71% of market goers in the national survey attend at least monthly in summer, the highest of any season. Here is how each product category does in the heat.
Fresh produce is what 92% of shoppers in the national survey say they commonly buy, and summer is when it is at its peak. The key to selling produce well is offering what is in peak season that week, not what you can grow in bulk.
Summer produce to plan around:
If you sell tomatoes by weight, do it on a legal-for-trade scale; without one, price a level quart basket of about 1.7 pounds at $4 to $5, set against the $5 quarts in Virginia's August 2026 report.
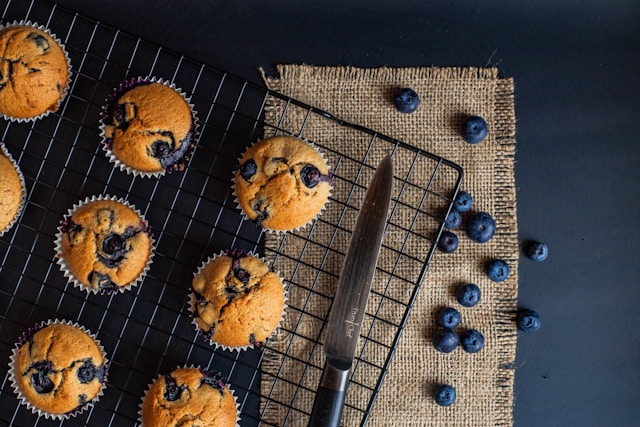
Unfrosted cookies, breads, scones, muffins, brownies, granola and biscotti hold up best in summer heat, because they have nothing to melt. Heat is the defining challenge for baked goods vendors in summer. Butter gets soft in a 68°F room and is close to liquid near 95°F, which means anything with buttercream frosting, chocolate coating or cream cheese icing becomes a liability on a hot market day, especially in direct sun.
What holds up in summer heat:
Swipe the table sideways to see what each baked good sold for.
| Product | Why It Works | What Homegrown vendors charged, September 30, 2026 |
|---|---|---|
| Cookies (no frosting) | Shelf-stable, no melt risk | Typically $2.35 a cookie across 76 bakers who state a cookie count |
| Scones and muffins | Berry varieties match the season | Single muffins from $2.00 to $3.50; a single scone at $2.99, and scone listings that do not state a count at $5.00 to $5.50; a half dozen muffins at $15 from four bakers |
| Breads and dinner rolls | Heat-stable, pairs with seasonal produce | A typical sourdough loaf at $12 across 72 bakers |
| Brownies (unfrosted) | Dense structure holds up | Single brownies from $3.00 to $8.00 |
| Granola and trail mix | Zero heat risk, long shelf life | Two examples: $10 for 12 ounces and $15 for 16 ounces |
| Lemon cookies and lemon loaf | Summer flavor, no frosting needed | Priced like your other cookies and loaves |
| Savory crackers | Herb-forward (rosemary, thyme) | One sourdough baker lists herb, butter and cheese crackers at $15 (bag size not listed) |
| Biscotti | Twice-baked and dry, so heat does not hurt it | $5 to $15 a listing; pack sizes vary |
Prices come from a pull of Homegrown's catalog on September 30, 2026. The cookie figure is the typical per-cookie price across 76 bakers whose listings state how many cookies you get. The sourdough figure is the typical full-loaf price across 72 bakers. Brownie, granola, muffin, scone, cracker and biscotti prices are the range of individual listings we read by hand that day, not a survey.
Lemon bars are a summer favorite too, but their filling is a baked egg curd. California's approved cottage foods list covers baked goods "without cream, custard, or meat fillings," so check your state's list before you bring them.
What fails in summer heat:
If you sell frosted products year-round, consider switching to an all-shortening frosting for summer months (shortening melts at about 115°F to 120°F), or pivot to unfrosted options entirely.
Jams, preserves and honey are ideal summer products because they are shelf-stable, heat-resistant and line up with peak fruit season. In the national survey, 39% of market goers said they commonly buy packaged products like jams, syrups and sauces, the most of anything after produce. Put peach jam next to the fresh peaches so a shopper buying peaches sees it.
On Homegrown, 69 jam, jelly and fruit butter listings from 17 vendors were live on September 30, 2026, at a typical starting price of $9 a jar (listed prices from $3 to $15 across size options, in jars from 4 to 16 ounces where the size is listed). 40 of the 69 named a strawberry, blueberry, blackberry, raspberry, cherry, peach, mixed berry or watermelon flavor, and 10 were pepper jams or jellies, 7 of them fruit mixed with hot peppers.
Summer jam flavors that match the season:
Summer-aligned preserved products:
Frame these products for summer use cases at your booth: peach jam for grilling, pepper jelly for a cheese board, corn relish for burgers. The use case sells the product. If jam is your main line, how to sell jam from home covers labels, jars and the rules.
Cut flowers are one of the highest-value summer crops for the space they take up. Virginia Cooperative Extension calls specialty cut flowers one of the most profitable field crops you can grow and cites an estimate of $25,000 to $35,000 per acre for field-grown cut flowers, and 17% of market goers in the national survey said they commonly buy cut flowers, as many as commonly buy cheese and dairy.
On Homegrown, 7 vendors listed 17 single bouquets, bunches and jars of fresh cut flowers on September 30, 2026, not counting subscriptions, dried flowers or plant starts. The typical starting price was $15, starting prices ran from $10 for a small vase to $95 for a large wrapped bouquet, and size options went up to $115.
Top summer cut flower varieties:
The strategy for flower vendors is to pair common varieties (zinnias, cosmos) with a statement flower (dahlia, lisianthus) to stand apart from produce vendors who sell a few zinnia bunches on the side. One Homegrown flower farm lists $15 single-variety bunches of zinnias, cosmos and sunflowers next to a $15 mixed market bouquet, which gives shoppers an easy yes at one price. For pricing by the stem and by the bunch, see how much to sell cut flowers for.
Bring bouquets in buckets of water and keep them in the shade of your canopy, not on the front of the table in full sun. University of Tennessee's zinnia budget plans on selling only 65% of the stems a bed produces, after losses and leftovers, so cut to what you can sell that day and take bouquet orders ahead for the rest.
Honey is one of the easiest add-on products at any farmers market, because it keeps for months and needs no cooling. Virginia markets charged $10 to $14 a pound for honey in August 2026. Honey keeps all year, but summer is when the most shoppers are walking past your table. Offer infused varieties (lavender, cinnamon) where your state allows them, and extension products (beeswax candles, lip balm) to raise the size of each sale.
Lavender products peak in summer: bundles, sachets, culinary lavender and lavender honey. Washington's seasonality chart shows lavender in July.
Handmade soap with summer scents (citrus, mint, lavender) is a small add-on purchase for many shoppers. Soap and other crafts sell to a smaller group than food, though: 18% of market goers said they commonly buy arts and crafts like soap, candles or jewelry, and in the Oregon sales study craft and art vendors sold about half as much per market day as farm vendors.
Strawberries and cherries lead in June, tomatoes, peaches and sweet corn arrive in July, and August brings nearly every summer crop at once, with Virginia tomatoes averaging $3.50 a pound that month. Summer is not one block. What sells shifts from June to August, and the exact weeks depend on where you are. Planning your inventory around these monthly shifts keeps your booth feeling fresh and gives customers a reason to come back every week. USDA's SNAP-Ed seasonal produce guide lists strawberries, cherries, blueberries, peaches, tomatoes, corn, cucumbers, summer squash, zucchini, bell peppers, green beans, okra, eggplant and watermelon among its summer produce, and the state charts below show when each one lands.
June brings cherries, the end of New Jersey's strawberries and the start of Michigan's, and the first cucumbers and summer squash. It is the transition from spring to summer, so check which crops the other tables at your market are bringing before you set your own lineup.
Peak June products:
For bakers and preserved food vendors: Strawberries are still in season in June on the Michigan chart, so strawberry products fit the month. Cherry jam and cherry hand pies have a narrow window, so plan them early.
July is when the big summer crops arrive on the Michigan, New Jersey and Washington charts, while Georgia is already in full swing. Tomatoes, peaches and sweet corn come in, and customers show up in force.
Peak July products:
For bakers and preserved food vendors: Peach products take center stage: peach jam, peach scones, peach hand pies. Blueberries come in from July on the Michigan chart, so blueberry products fit the month too.
August brings tomatoes, sweet corn, melons, peppers and late peaches all at once, at an average $3.50 a pound for tomatoes and $10.58 a dozen for sweet corn at Virginia markets in August 2026. It is the abundance month. Nearly everything is available at once, so the table next to yours may carry the same tomatoes and corn, and variety is what sets your table apart.
Peak August products:
For bakers and preserved food vendors: Tomato-based products emerge: tomato jam, and salsa where your state allows it. California's approved cottage foods list has no salsa or relish, while Texas allows plant-based acidified canned goods made from an approved recipe source (such as the USDA canning guide), with a batch number on every label (see the license section below). Late-summer berry jams fit the month too. Start teasing fall flavors in the last week of August to build anticipation, and see our best-selling fall farmers market products for what comes next.
Set up online ordering so customers can place midweek orders for market-day pickup.
The same crop can arrive two months apart depending on your state: Georgia's peaches start in May, while Michigan's and New Jersey's start in mid-July, and Washington's tomatoes run into November. Here is what four state charts say, one per region.
Slide sideways to see all four states.
| Product | Georgia (Southeast) | Michigan, Lower Peninsula (Midwest) | New Jersey (Northeast) | Washington (Pacific Northwest) |
|---|---|---|---|---|
| Peaches | May to August | Mid-July to mid-September | Mid-July to mid-September | July to September |
| Tomatoes | June to October | Mid-July to early October | July to October | July to November |
| Sweet corn | June to August | Mid-July to mid-September | July to September | July to October |
| Blueberries | May to August | July to September | Mid-June to July | July to September |
| Strawberries | March to May | June to early July | Mid-May to early June | May to September |
| Watermelon | June to September | Late August to September | Not on the chart | August to October |
| Apples | July to November | Summer apples late July to August; fall apples from mid-August | Mid-July to December | All year from storage; harvest peaks September to November |
Sources, all loaded September 30, 2026: University of Georgia's Georgia Produce Seasonality Chart (FARE blog, December 2025); Michigan State University Extension's Lower Peninsula Seasonal Produce Availability Guide (2025); the New Jersey Department of Agriculture's NJ Seasonality Chart (2011); and the Washington State Department of Agriculture's Washington Grown seasonality charts (2022). Each chart shows when a crop is commonly available, not its single best week, and dates shift a week or two with the weather.
Southeast note: Georgia's season starts early and runs long. Strawberries are done by June, peaches and blueberries run May through August, and summer squash, okra and peppers keep going into October. In the hottest weeks, some vendors lean into preserved foods and baked goods while they wait for fall crops.
Pacific Northwest note: The Pacific Northwest has exceptional berry diversity, with strawberries on Washington's chart from May through September and raspberries from June through August. Walla Walla sweet onions are a regional standout, on Washington's chart from June through September.
Skip anything that melts, sweats or spoils at 90°F unless you have real cooling. It is usually easier to adjust the lineup for the season than to fight the weather.
Skip these in summer unless you have active cooling:
Products that are naturally heat-proof:
If you want to keep selling heat-sensitive products, some vendors use a display case with ice packs and a small battery fan as a low-cost cooling setup. But it is usually simpler to change the lineup.
Summer heat does two kinds of damage: it ruins how a product looks, and it can make perishable food unsafe. Butter-based frostings and chocolate lose their shape in the 80s and 90s. Anything perishable has a hard time limit once it leaves the cooler.
The time limit comes from USDA's Food Safety and Inspection Service. Bacteria grow fastest between 40°F and 140°F, which it calls the "Danger Zone," and its rule is plain: never leave food out of refrigeration over 2 hours, and no more than 1 hour if the temperature is above 90°F. Cold food should stay at or below 40°F, in containers on ice.
Here is how that plays out at a summer booth:
Start with shade. A 10 by 10 canopy over the table keeps direct sun off everything you sell, and coolers go under the table, not behind it in the sun. Put a cheap thermometer on the table at setup and check it at 10am: if it reads over 90°F, move anything perishable into the cooler, because USDA's limit drops to 1 hour.
Summer brings the most shoppers of any season, though not always a bigger basket per shopper. In the national survey, 71% of market goers attend at least monthly in summer, against 45% in fall, 41% in spring and 10% in winter. At one large Wisconsin market, researchers found no significant difference between what shoppers spent per visit in winter and at the Saturday summer market, so summer's advantage is the crowd.
Here is how the numbers break down:
Swipe left to see where each summer number comes from.
| Metric | Summer data | Source |
|---|---|---|
| Market goers who attend at least monthly, by season | Summer 71%, fall 45%, spring 41%, winter 10% | National survey of 4,128 attendees, run 2023 |
| Typical spend per trip | $25 to $50 for 40% of shoppers; $10 to $25 for 32%; under $10 for 5% | Same survey |
| Vendors visited per trip | 2 to 5 vendors for 73% of shoppers | Same survey |
| Average spend at a Saturday summer market | $29.41 per visit; the weekday (Wednesday) summer market averaged $5.91 less | Dane County Farmers' Market, Wisconsin, Choices magazine, 2018 |
| When the largest single sales happen | At the start of the market or even before it opens, then lower every hour after | 26,000+ sales by 10 livestock farms at 22 New York markets, 2021 |
| Effect of rain | Each inch of rain on a market day went with about 8% lower sales | Five rural Oregon markets, 2019 to 2021 |
Sources: Witzling, Shaw and Wolnik (2025); Zepeda and Carroll, "Who Shops at a Mature Farmers' Market?" Choices, 3rd quarter 2018; Rigotti, LeRoux and Schmit (2023) as reported by the Cornell Chronicle; Rahe, Tsay and Low (2025). Each comes from one study's markets, so treat them as patterns, not forecasts for your town. Read September 30, 2026.
Peak traffic timing: In the Cornell study of more than 26,000 transactions by 10 livestock farms at 22 New York markets, the largest single sales came at the beginning of the market or even before it opened, and transaction totals fell hour by hour after that. The same study found people spent less per sale when the booth was busiest. Be fully set up before opening, and bring a helper for the first hour if you can.
Saturday versus weekday: At the Dane County Farmers' Market in Madison, Wisconsin, the average shopper spent $29.41 at the Saturday summer market and $5.91 less at the Wednesday summer market, which has fewer vendors and serves downtown workers. A weekday market can still be worth it, but plan smaller.
The July 4th bump: Some markets plan special events around Independence Day. Grilling and BBQ-adjacent products (spice rubs, pepper jelly, corn relish where allowed, herb bunches for grilling) fit that week well.
Rainy day effect: Rain cuts sales. In the Oregon study, each inch of rain on a market day went with about 8% lower sales for the average vendor, a weak but real pattern. The New York livestock study found that once shoppers get to the market, weather made no clear difference to how much each one spent. Stock less volume on rainy days but keep your full product range, and see our rainy market day tips for the setup.
In August 2026, Virginia farmers markets charged an average of $3.50 a pound for tomatoes, $10.58 a dozen for sweet corn, $3.95 a pound for peaches and $4.71 for a cantaloupe. Those are the averages Virginia's state market news service printed from what managers at nine markets reported for the month, eight in Virginia and one in Bristol, Tennessee. Use them as a starting point, and check your own market's tables.
Swipe sideways to see the range and average for each product.
| Product | Unit | Range across markets | Average |
|---|---|---|---|
| Tomatoes | Pound | $2.49 to $5.00 | $3.50 |
| Heirloom tomatoes | Pound | $3.00 to $4.29 | Not averaged in the report |
| Cherry tomatoes | Pint | $3.00 to $6.00 | $4.18 |
| Sweet corn | Dozen | $8.00 to $15.00 | $10.58 |
| Peaches | Pound | $2.99 to $4.50 | $3.95 |
| Cantaloupes | Each | $3.00 to $7.00 | $4.71 |
| Blackberries | Pint | $5.00 to $7.00 | $6.00 |
| Blueberries | Pint | $5.00 to $7.00 | Not averaged in the report |
| Watermelons | Each | $5.00 to $10.00 | Not averaged in the report |
| Green beans | Pound | $3.00 to $5.00 | $4.00 |
| Cucumbers | Each | $1.00 to $2.00 | $1.28 |
| Peppers | Each | $0.75 to $2.49 | $1.40 |
| Herbs | Bunch | $2.00 to $5.00 | Not averaged in the report |
| Honey | Pound | $10.00 to $14.00 | Not averaged in the report |
Source: Virginia Market News Service, Retail Farmers' Markets report dated August 31, 2026 (with a September 4 update), loaded September 30, 2026. Averages are from the report's August price summary; rows marked "not averaged" are the range of prices on the individual market pages. Market managers submit these prices monthly.
Baked goods, jams and flowers are not in that report, so here is what Homegrown vendors charged on September 30, 2026, from a pull of the catalog:
In a pull of the Homegrown catalog on September 30, 2026, vendors had placed 1,404 of 2,773 listings (51%) in the Bakery category and, among the other categories, 299 in Pantry Goods, 187 in Ready-to-Eat Food, 143 in Health and Wellness, 129 in Vegetables, 115 in Meat and Poultry, 105 in Plants and Flowers, 97 in Arts and Crafts, 77 in Home Goods, 62 in Beverages, 51 in Eggs and Dairy, 44 in Pet Supplies and 40 in Fruits, across 311 vendors. Those are listings in the categories vendors chose, not sales. We counted jam and flower listings by reading every match by hand: a jam, jelly, preserve, marmalade or fruit butter named in the listing's name, description or size options, and fresh cut flowers sold as a bouquet, bunch, jar or vase, leaving out subscriptions, dried flowers and plant starts. The jam count covers every category vendors chose, which is how a peach butter filed under Health and Wellness made the list.
If you are shopping rather than selling, the best things to buy at a summer farmers market are the crops at their peak that week: strawberries and cherries in June, then blueberries, peaches, tomatoes and sweet corn in July and August, depending on your state. Those are the foods a grocery store cannot match for freshness, and they are what 92% of market goers say they commonly buy.
A few tips that help shoppers and vendors alike:
Besides produce, the products shoppers buy most at farmers markets are packaged foods like jam, baked goods and eggs, followed by garden plants, crafts, cut flowers, dairy, drinks and ready-to-eat meals. In the national survey, 39% of market goers commonly buy packaged products and 38% commonly buy bakery products, while 18% commonly buy arts and crafts like soap, candles or jewelry.
Foods on the California, Florida and Texas cottage food lists include (check your own state's list before you make them):
Non-food products that sell at many markets:
Check your market's rules before you plan a craft table, because each market sets its own rules on whether and how many craft vendors it takes. And plan for a smaller crowd: in the Oregon study, craft and art vendors sold about half as much per market day as farm vendors.
For year-round ideas with the cost of each product worked out, see our guide to the most profitable foods to sell at farmers markets.
It depends on the product and your state. Home-made foods fall under your state's cottage food law, and each state lists what it allows; the three states below show how much those lists differ. Cottage food laws cover foods made at home, so for fresh produce you grew, ask your state agriculture department and your market manager what applies before you sell it. Summer favorites like salsa, relish, infused honey and cream-filled pastries are products that some state lists leave out, so check yours first.
Here is what three state agencies say, loaded September 30, 2026:
Slide the table sideways to read each state's rules and cap.
| State | What summer vendors should know | Annual sales cap |
|---|---|---|
| California | Baked goods must be without cream, custard or meat fillings. Frostings cannot contain cream or cream cheese, or raw eggs (meringue powder, powdered eggs and pasteurized eggs are allowed). Honey must be pure with no added ingredients. Jams and jellies must use fruits listed in 21 CFR Part 150, and the list has no salsa or relish | Set by the state each year (see the cottage food laws guide below) |
| Florida | Allowed products include breads, cakes, cookies, candies, honey, jams, jellies, preserves, fruit pies, dried fruits, dry herbs and seasonings, granola, nuts, vinegars and popcorn. Free samples must be prepackaged | $250,000 in gross sales a year |
| Texas | Any food except meat, poultry, seafood, ice and ice cream products, low-acid canned goods, cannabis products and raw milk. Pickled, fermented and plant-based acidified canned goods must follow an approved recipe source (such as the USDA Complete Guide to Home Canning) and need a unique batch number on each label. Every operator must complete an accredited food handler course. Foods that need time and temperature control require registration with the state health department | $150,000 |
Sources: the California Department of Public Health's Approved Cottage Foods list (last reviewed April 2026), the Florida Department of Agriculture and Consumer Services cottage foods page, and the Texas Department of State Health Services cottage food production page, all loaded September 30, 2026. Rules change, so verify your state's current rules before your first market.
A product that is legal in one state can be banned next door. California's list allows jams only from fruits named in the federal standard, while Texas allows acidified canned goods like salsa when they are made from an approved recipe source (such as the USDA canning guide), with a batch number on each label. Before you add a summer product, read your own state's list, not a neighbor's. Our cottage food laws by state guide has every state's cap and agency.
One market day in a farmers market booth cost a home baker $20 to $84 at the seven markets we read for our booth cost guide in September 2026, and Portland's Saturday market charges bakeries 9% of sales when that is higher than its $84 day rate. Some markets also sell a season stall that covers every week of the season, and most of the season prices in our booth cost guide were paid up front, though Muskegon, Michigan splits its stall into two payments.
Before you sign up for a full season, ask the manager three questions: how many shoppers come on a typical July Saturday, how many other tables sell what you sell, and whether you can try a few single days before you commit. A new booth also takes time to build: in the Oregon study, beginning vendors sold about 11% less per market day than established ones after accounting for vendor type, attendance, crowd size, weather and market, so judge a market on a month of Saturdays, not one.
To decide whether a summer market pays, count the booth in sales, not dollars. At a $12 product that keeps about $8.80 after ingredients, you need 3 sales to cover a $20 day and 10 sales to cover an $84 one. Our breakdown of the real cost of selling at farmers markets adds ingredients, packaging, gas, insurance and your time.
Build your summer lineup in layers: keep the 3 to 5 products that already sell for you, add 2 or 3 summer products in small batches, and put a few low-priced impulse products at the front of the table. Here is a practical framework.
Do not overhaul your entire booth for summer. Keep your top 3 to 5 products that sell year-round, then add 2 to 3 seasonal products. In the Oregon sales study, vendors who came to more market days had higher sales per day, and beginning vendors sold about 11% less than established ones after accounting for vendor type, attendance, weather and market. Consistency and a known lineup are part of what builds sales.
Bring a small batch of 10 to 15 units of a new summer product alongside your proven products. Watch what sells out and what goes home, and write it down every market day. If you need help with this process, read our guide on how to test a new product at the market without committing to a full batch.
Keep 2 or 3 products between $3 and $8 at the front of your booth. Products in this range (single cookies, small jam jars, herb bunches, soap bars, honey sticks) are easy to say yes to, and Homegrown vendors' real prices sit right there: 5 jam makers listed a 4-ounce jar at $5, and two cookies at the typical $2.35 each come to about $4.70. In the national survey, most shoppers spend $10 to $50 per trip across two to five vendors, so a $5 add-on fits inside almost anyone's budget.
Bundle products around a summer use case:
Bundles are a way to raise your average transaction size and give customers a reason to buy more than one product. Price a bundle below the sum of its parts at your own prices, so the deal is real. Our guide to bundle pricing for food vendors shows how to set the number.
Change at least one product or flavor each week. Customers who visit every Saturday need a reason to stop at your booth instead of walking past. A new flavor, a seasonal special, or a limited-run product creates that reason.
Weekly rotation builds regulars, but regulars who can only buy on Saturday miss whatever you baked fresh on Wednesday. An ordering page lets your market customers place a midweek order for pickup at next Saturday's booth, which means you know exactly how much to bake before you start.
Summer brings you the biggest crowd of the year, and most of those shoppers only see you for a few minutes on market day. Homegrown gives you an ordering page where your summer regulars order and pay between markets for pickup at your booth, for $10 a month billed yearly with no percentage fees beyond standard payment processing of 2.9% + $0.30 per order. List this week's summer lineup with photos and prices, and your regulars can order instead of hoping you still have blueberry scones left when they arrive at 10am.
What that looks like for a summer vendor:
Here is how the fees compare with two other ways to take orders, Square at the booth and Etsy online:
Move the table sideways to see every fee for each way to take orders.
| Platform | Monthly plan | Trial | Platform or transaction fee | Card processing | Vendor pays on an $8 jar of jam | Vendor pays on a $20 order | Vendor pays in a month of 50 orders at $20 |
|---|---|---|---|---|---|---|---|
| Homegrown | $10 billed yearly ($12.50 billed monthly) | 7 days, no charge until day 8 | None, 0% commission | 2.9% + $0.30, paid by the vendor | $0.53 plus the plan | $0.88 plus the plan | $54.00 ($56.50 on the monthly plan) |
| Square, Free plan | $0 | No paid plan to try | None | 2.6% + 15¢ in person; 3.3% + 30¢ online | $0.36 in person; $0.56 online | $0.67 in person; $0.96 online | $48.00 online |
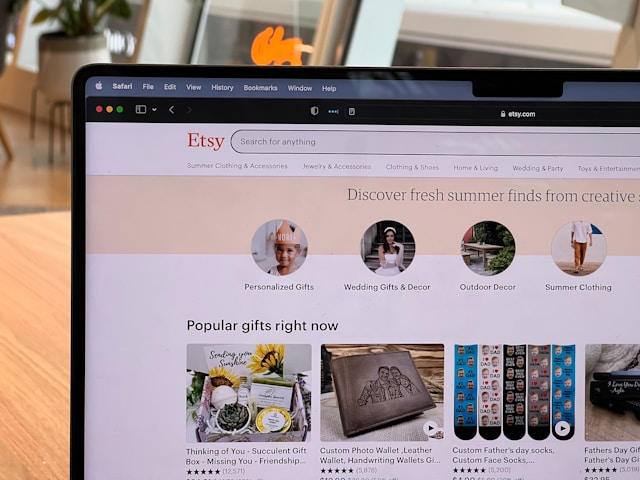
| Etsy | $0 | None; a one-time set-up fee may apply | $0.20 listing fee per item listed, plus 6.5% of the sale; 15% Offsite Ads fee on sales from Etsy's ads | 3% + $0.25 (U.S.) | $1.21 | $2.35 | $117.50, more if an ad drives a sale |
We checked these fees on findhomegrown.com/signup, Square's fee page and Etsy's Fees and Payments Policy and Etsy Payments Policy on September 30, 2026. The customer pays the listed price on all three, with no added service fee. Card processing is figured on the item price; if a platform charges it on a total that includes tax or shipping, it runs a few cents higher. The Etsy column counts one $0.20 listing fee per sale, because Etsy renews a listing for $0.20 each time an item sells. Etsy's Offsite Ads fee is 15% with an opt-out for shops under $10,000 a year in sales, and 12% with no opt-out above that.
Square is the right tool for the card reader at your booth, and you can keep using it there. Etsy reaches shoppers nationwide, but its fees run more than twice Homegrown's on a $20 order and it is built for shipping, not for picking up peaches at your booth on Saturday. Homegrown is built for the local part: the regulars who already know your table.
Homegrown will not set up your booth, keep your coolers cold or bring shoppers to the market for you. Your storefront is listed on Homegrown's marketplace, but plan on most orders coming from people you send to your own link. Customers create a Homegrown account to place their first order. There is no drops or countdown release feature, and no price-by-the-pound checkout yet, so list produce in fixed sizes like a pint, a quart or a dozen, each with its own price. And having a storefront does not make a product legal to sell; your state's cottage food or produce rules still apply. You get 7 days to try it, with no charge until day 8.
Turn this summer's crowd into regulars who order ahead. Set up your Homegrown storefront before your next market and put the QR code on your booth sign.
No public data ranks single products by sales, so no one can honestly name one best-selling product. The closest evidence is a national survey from 2023, published in 2025, where produce was the one thing nearly everyone buys (92% of market goers), far ahead of any other type. In summer that means in-season tomatoes, berries, peaches and sweet corn. For non-produce vendors, packaged products like jam (39% of shoppers) and bakery products (38%) are the next most common purchases.
Cookies without frosting, scones, breads, muffins, brownies, granola, lemon cookies and biscotti all hold up well in summer heat. Avoid anything with buttercream, chocolate coating, cream cheese frosting, fudge or caramel, since butter melts at roughly 90°F to 95°F. On Homegrown in September 2026, the typical cookie was listed at $2.35 and the typical sourdough loaf at $12.
It depends on your products, prices and market. In a study of five rural Oregon farmers markets from 2019 to 2021, established vendors averaged $489 in sales per market day and beginning vendors $385 (a raw gap of about 21%, which the study's model put at about 11% once vendor type, attendance, crowd size, weather and market were accounted for), and farm product vendors sold more than craft vendors. Summer gives you the biggest crowds, with 71% of market goers attending at least monthly in summer in the national survey. Your take-home pay is what is left after booth fees, ingredients and your time.
Berry flavors (strawberry, blueberry, blackberry, raspberry) and stone fruit flavors (peach, cherry, plum) match what is fresh at the market in summer. Among 69 jam and jelly listings on Homegrown in September 2026, strawberry was the flavor vendors listed most, followed by peach, and 7 listings mixed fruit with hot peppers. Those counts show what vendors offer, not what sells most. Lemon, lavender and fresh herbs like basil and rosemary also fit summer. Save pumpkin, apple cider and cinnamon for September.
Yes. Adjust your lineup to the season. This does not mean a complete overhaul: keep your proven year-round products and add 2 to 3 summer-specific products. Drop products that struggle in heat, and add seasonal flavors that match what is fresh at the market that month.
The first hour, at least for the largest single sales. In a Cornell study of more than 26,000 sales by 10 livestock farms at 22 New York farmers markets, the largest single purchases came at the start of the market or even before it opened, and transaction totals fell each hour after that. The study did not cover bakery or produce tables, so treat it as a pattern to test at your own booth. Arrive early, be fully set up before the market opens, and have your display ready for the first wave of shoppers. Saturday can beat a weekday too: at the Dane County Farmers' Market in Wisconsin, shoppers spent $5.91 less per visit at the Wednesday summer market than on Saturday.
Use shade, coolers and ice. Put a canopy over the table, keep anything perishable in a cooler at or below 40°F, and follow USDA's rule of no more than 2 hours out of refrigeration, or 1 hour when it is above 90°F. Some vendors add a display case with ice packs and a small battery fan. The simpler approach is usually to switch to heat-stable products from June through August.
These guides answer the next questions most summer vendors have:
Summer is where the traffic is, so use it to build a customer list you can keep selling to all year, through the fall and winter, not just from June through August when the crowds are biggest.