

The short version: USDA's national survey of market managers works out to about $582 in sales per vendor on an average peak-season market day ($14,547 per market divided by 25 vendors, 2019), but a rough ratio of USDA's market-size averages comes to about $96 a vendor at small markets and $179 at medium ones. A survey of 775 registered cottage food vendors found median sales of $2,000 a year and a median profit of $500. The sales figures are gross, before ingredients, packaging and a booth fee that ran $10 to $90 a day at the five markets whose current fee pages we checked. Your own number is your average sale times your sales per day times your market days, minus costs, and pre-orders between markets add sales without another booth fee.
Checked October 1, 2026: USDA's National Farmers Market Managers 2019 Summary and its market-size brief, the Institute for Justice report Flour Power, five 2026 market fee pages, and findhomegrown.com/signup. Homegrown is $10 a month billed annually ($12.50 billed monthly) with 2.9% + $0.30 card processing paid by the vendor. Customers create a Homegrown account to place a first order, and there is no drops feature.
Farmers market income varies dramatically from one vendor to the next. Some vendors sell under a hundred dollars on a peak-season day at a small market. Others at big city markets average several hundred dollars a day. And a small group of farms sell $500,000 or more a year direct, counting sales to stores and institutions as well as markets: 2% of direct sellers in USDA's 2020 survey, taking 55% of that money.
If you have a target in mind, our income goal calculator works backwards to the number of orders a week you need.
The range is wide because the answer depends on what you're selling, how you price it, how busy your farmers market is, how many market days you attend, and whether you've built a base of repeat customers who show up looking for your booth every week.
This guide gives you the published numbers (USDA surveys, state associations, markets' own annual reports, a 775-person survey of cottage food vendors and Homegrown listing prices), each with whose data it is and the year. Then it walks through the math so you can estimate your own.
USDA's best national number is about $582 in sales per vendor for an average market day in peak season. That comes from the National Farmers Market Managers 2019 Summary, released by USDA's National Agricultural Statistics Service in August 2020. Managers reported an average of $14,547 in total sales per market on an average market day and an average of 25 vendors on a peak market day. Divide one by the other and you get $581.88. Treat that as a rough ratio, not a measured figure: it divides one average across markets by another, and NASS's tables label the sales an average market day and the vendor count a peak market day.
Here is what that survey covered, so you know how much weight to give it:
Dividing the same survey's figures gives about $16 per household on an average market day across all vendors ($14,547 divided by 916 households). That one number tells you a lot. Your sales depend on how many of those households stop at your table, not on how big the crowd looks.
Market Performance, a second USDA and Wheaton College report on the same 2019 survey, reports a different national sales average ($11,615 per peak-season market day). The two reports do not explain the gap, so we use the official NASS summary for the national figure. A third brief from the same team splits the survey into four market sizes, and we use it only for the size split, where the per-vendor picture changes a lot. These are the average vendors and average peak-season sales by market size, with our division in the last column. The brief ranks markets into size groups separately by vendor count and by sales, so the small group by vendors and the small group by sales are not necessarily the same markets, and it says the groups are for benchmarking, not performance. Read the last column as a rough ratio, not a measured sales figure:
Swipe sideways to see sales per vendor at each market size.
| Market size (USDA quartile) | Average vendors | Average peak-season sales per market day | Rough sales per vendor per day (our ratio) |
|---|---|---|---|
| Small | 7 | $670 | $96 |
| Medium | 14 | $2,510 | $179 |
| Large | 23 | $7,614 | $331 |
| Extra-large | 60 | $34,175 | $570 |
Source: USDA AMS and Wheaton College, 2019 National Farmers Market Manager Survey brief, "Market Characteristics, Organization, and Activities by Market Size," Figure 1 (U.S. row), loaded October 1, 2026. Per-vendor figures divide each size group's average sales by the same-named group's average vendors, rounded to the dollar. The brief ranks markets by sales and by vendors separately, so each figure is a rough ratio. They are gross sales for all vendor types.
Rough sales per vendor per peak-season market day, by market size
Source: USDA AMS and Wheaton College brief on the 2019 National Farmers Market Manager Survey, Figure 1, U.S. row. Average sales divided by average vendors; the brief groups markets by each measure separately, so these are rough ratios. Loaded October 1, 2026.
The takeaway: by this rough ratio, sales per vendor at extra-large markets ran about six times those at small markets on a peak-season day ($570 against $96). Where you sell matters a lot.
Once the numbers work, make ordering effortless. Take orders and get paid online in about 15 minutes: set up a Homegrown storefront ($10/mo billed annually, 0% commission, 2.9% + $0.30 card processing), or compare the best platforms to sell food from home.
No survey we found follows the same vendors from their first market to their fifth season, so nobody can honestly give you a dollar figure for "year one" versus "year three." What the data does show is the range by market size, the typical cottage food business, and the share of vendors who return each year. The table below puts the sourced numbers next to each stage so you can see where you are likely to land.
Scroll right for whose data sits behind each stage.
| Vendor Stage | Closest sourced figure (not measured by stage) | Whose data, how many | Key Characteristics |
|---|---|---|---|
| First-time (first farmers market) | Roughly $96 to $179 per vendor per day at small and medium markets (a ratio of two separately grouped averages) | USDA 2019 market size brief, U.S. averages | Learning experience, figuring out volume and setup |
| First season, part-time cottage food | $2,000 median sales a year, $500 median profit | Institute for Justice, 775 cottage food vendors in 22 states, 2016 | Building recognition, inconsistent week to week |
| Established (year 2+) | $13,150 average sales per vendor per market season | Washington State Farmers Market Association, 107 markets reporting, 2023 | Repeat customers, refined product lineup |
| Multi-market serious | $47,980 average sales per vendor for the season at one big market (no survey we found reports vendors who sell at several markets) | Columbia Farmers Market, Missouri: $4.75 million across 99 vendors, 67 market dates, 2024 | Many market days, fully optimized operation |
All figures are gross sales before the vendor's costs, loaded October 1, 2026. The Washington and Columbia figures are total vendor sales divided by vendor count, and they include farms selling produce and meat, not only cottage food. Columbia's figure is one large market's average, not a typical vendor. The cottage food survey covers home food businesses of every age, not only first-season ones, and USDA's market-size averages cover every vendor at those markets, not only first-timers.
First-time vendor at their first farmers market. Expect your first day to be a learning day. Dividing USDA's market-size averages puts sales per vendor at small and medium markets at roughly $96 to $179 a peak-season day, and until you have regulars, plan on your market's average as a ceiling, not a floor. You're still figuring out how much product to bring, how to set up your booth, and how to talk to customers.
Establishing vendor in their first season. Inconsistency is normal at this stage. One week strong, the next week half that, depending on weather, farmers market attendance, and what you brought. The Institute for Justice survey is the best picture of a part-time home food business: median sales of $2,000 for the whole year, and 49% of those 775 vendors said they typically sell at farmers markets.
Established vendor in year two and beyond. The improvement comes mostly from repeat customers who now know your booth and seek you out, plus better production planning. In Washington, where the state association collects sales from its member markets, vendors averaged about $13,150 in sales per market for the 2023 season ($80,922,771 in total vendor sales divided by 6,154 vendor spots, where a vendor at two markets counts twice).
Serious multi-market vendor. At this level, you've optimized everything: your product lineup, your pricing, your booth setup, your production schedule. One big market shows the ceiling: Columbia Farmers Market in Missouri reported $4.75 million in estimated vendor sales across 99 vendors and 67 market dates in 2024, or about $47,980 per vendor.
These ranges are broad because a vendor selling cookies at a small rural farmers market is in a completely different situation than someone selling artisan bread at a major urban farmers market. A second USDA brief from the 2019 survey, written with Wheaton College, shows urban markets drawing nearly three times the shoppers of rural ones on a peak season day (891 households against 315).
Farmers market revenue comes down to a simple formula: average transaction value multiplied by number of transactions. Every strategy for making more money at a farmers market comes back to increasing one or both of those numbers. The USDA survey above gives you the market-wide version of the same math: $14,547 in sales from 916 households is an average of about $16 per household across every booth.
Let's build a concrete example. These inputs are an illustration, not a survey average. Say you sell cookies, brownies, and a small jam offering. Your average customer buys two products at mixed price points, putting the average transaction at about $14. On a typical five-hour market day, you complete 40 transactions. That gives you $560 in gross revenue for the day.
Now subtract your costs:
Run that across a season of 30 market days: $10,560 left after ingredients and booth fees from a part-time operation with minimal overhead. Card processing, packaging, gas, insurance and taxes still come out of that.
Now see what happens when you adjust the inputs:
Slide the table to compare the four price and traffic scenarios.
| Scenario | Avg Transaction | Transactions/Day | Gross Revenue | Left after 30% + $40 fee |
|---|---|---|---|---|
| Baseline | $14 | 40 | $560 | $352 |
| Higher transaction value | $18 | 40 | $720 | $464 |
| More transactions | $14 | 55 | $770 | $499 |
| Both improved | $18 | 55 | $990 | $653 |
Example inputs, not survey data. Left = gross minus 30% for ingredients minus a $40 booth fee, before other costs. Re-run it with your own prices and your market's real fee.
Small improvements in either number compound across your whole season. A $3 increase in average transaction value across 30 market days with 40 transactions per day is an extra $3,600 in sales for the year (3 × 40 × 30), or $2,520 after 30% ingredient costs.
In the four published sources below that give a vendor count per market day, sales per vendor ran from about $146 to about $582 a market day. A few market managers and state associations publish total vendor sales, market days and vendor counts, which is enough to do the division yourself. Two more we loaded have no per-day vendor count: Washington's state report gives $29,352 in average vendor sales per market day and 58 vendors per market over the season, about $506 a vendor if all 58 sold every day (so a floor), and Columbia, Missouri works out to about $716 a market date (see the commitment table below). Here are the four with a per-day vendor count:
Drag sideways for each market's totals and our division.
| Market or group (season) | Total vendor sales | Vendors and days | Sales per vendor per market day (our math) |
|---|---|---|---|
| Eastern Ingham Farmers Market, Williamston, Michigan (2024) | $93,720 estimated, from the 46% of vendors who reported | 28 vendors per market on average; 23 Sunday markets (inferred from the report's line on sponsors covering "18 of 23 Markets") plus a holiday market | About $146 (could run either way: the total includes the holiday market, but only 46% of vendors reported and the report says part of the season was not accurately reported) |
| Gallatin Farmers Market, Tennessee (2024) | $71,778.50 reported | 15 vendors per week on average, 25 market days | About $191 |
| New Mexico Farmers' Marketing Association survey (2024) | $17,237,865.61 from 45 markets | 38,354 vendor days at 47 markets | About $449 (slightly low, because 2 of the 47 markets did not report sales) |
| USDA national survey (2019) | $14,547 per market per market day | 25 vendors on a peak market day | About $582 |
Sources, all loaded October 1, 2026: Sowing Growth's 2024 annual report for the Eastern Ingham Farmers Market; the Gallatin Area Chamber of Commerce's 2024 Gallatin Farmers Market Report; the NMFMA Market Data Survey 2024 Results; USDA NASS National Farmers Market Managers 2019 Summary. Totals are gross sales reported by managers or vendors. Reported sales can undercount when some vendors do not report.
A few patterns stand out in these reports:
Ask your market manager for last season's annual report before you apply. Gallatin's is one page and lists total vendor sales ($71,778.50), market days (25) and average vendors per week (15). Divide the first by the other two and you have the average vendor day at that market, about $191, before you spend a dollar on a booth fee.
The best survey of home food businesses found median sales of $2,000 a year and a median profit of $500. That is the Institute for Justice's Flour Power report, which asked 775 home food sellers registered in 22 states about their 2016 businesses. Cottage food means shelf-stable foods made in a home kitchen under a state law that allows it: cookies, bread, jam, granola and the like.
What else the survey found:
Set that median profit beside the hours these vendors put in and it is clear most of these businesses were not paying their owners a wage. They were extra money and a creative outlet. That is not a reason to skip it. It is a reason to set your goal on purpose. The survey does not say what the top sellers did differently, but the math in this guide shows the levers: more market days, a bigger average sale, and sales between markets.
Every income figure on this page is gross sales unless it says profit. A $582 market day is what customers paid, not what the vendor kept. Ingredients, packaging, the booth fee, card processing and your own hours all come out of it. The Flour Power report is the only source here that reports profit, and its median was $500 a year.
Averages for farmers market sales get pulled up by a few very large sellers, so the typical vendor makes less than the average. Direct farm sales overall, which include sales to stores and institutions as well as markets, are lopsided in USDA's 2020 Local Food Marketing Practices Survey: operations with $500,000 or more in direct food sales were 2% of all direct marketing operations but received 55% of the money.
You can see the same spread inside single surveys:
So when you read "the average vendor makes $X," ask three questions. Is it the average or the median? Is it sales or profit? And whose market is it? A median from a survey like the cottage food one is a better guide to a typical seller than an average.
Farmers markets are also only one slice of direct sales. In the same 2020 USDA survey, farmers markets accounted for $514 million of the $2.9 billion farms sold directly to consumers, behind on-farm stores and stands at $1.231 billion.
In our ratio of USDA's size data, the gap between a roughly $96 vendor day and a $570 vendor day is market size, which is a choice you make when you apply. Inside any market, five more factors are under your control.
Your product margins determine how much of each dollar you actually keep. Margin here means the share of the sale left after ingredients and packaging. It depends on your recipe and your price, so we show the math rather than a made-up margin for each product type.
What you keep from $20,000 in gross sales at different ingredient and packaging cost shares:
Move the table left to see what you keep at each cost share.
| Ingredient + packaging cost share | Margin | Revenue Kept on $20K Gross | Notes |
|---|---|---|---|
| 20% of the price | 80% | $16,000 | Dry goods with cheap bulk ingredients and long shelf life |
| 30% of the price | 70% | $14,000 | Simple baked goods with a moderate ingredient list |
| 40% of the price | 60% | $12,000 | Butter-heavy or nut-heavy recipes, or prices set too low |
| 50% of the price | 50% | $10,000 | Expensive ingredients plus unsold perishable products |
Pure math: $20,000 × (1 − cost share). Booth fees, card processing and your time come out of what is left. Weigh your own recipe and divide its cost by your price to find your row.
The difference between a 70 percent margin and a 50 percent margin is massive when multiplied across a season. On $20,000 in gross revenue, that's the difference between keeping $14,000 and keeping $10,000. Most profitable foods to sell at farmers markets breaks down which products tend to have the best margins and why, and the jam example later in this guide shows what vendors list one real product at.
More foot traffic directly translates to more potential transactions and more income. USDA's market performance brief on the 2019 survey, written with Wheaton College, counted 780 households nationally on a peak season day: 315 at rural markets, 431 at suburban markets and 891 at urban markets, and the Western region averaged 1,184. Those run lower than the NASS summary's 916 households on an average market day, and the two reports do not explain the gap. Bigger crowds are one reason sales per vendor differ by market size (roughly $570 a day at extra-large markets against $96 at small ones, by our ratio).
Before committing to a farmers market, research the attendance numbers. Many market managers will share weekly visitor counts if you ask, and some publish them: Gallatin, Tennessee averaged 292 people on a market day in 2024. If they don't have data, visit the farmers market as a customer on a typical Saturday. Count the people who walk past a given booth in 15 minutes and multiply by four to estimate the hourly traffic.
Income scales roughly proportionally with the number of farmers markets you attend. Using New Mexico's 2024 average of about $449 in sales per vendor day and Washington's average season of 26 market days:
Those are gross sales. Each extra market adds its own booth fee, travel and a full production day, so your take-home grows a little slower than your sales. You can start with one farmers market and add more as you build confidence in your production capacity. Adding a second farmers market is one of the most straightforward ways to increase income, and selling at multiple farmers markets covers how to plan production for two.
Underpricing is a costly mistake for new vendors. Many farmers market shoppers expect to pay more than grocery prices and are not there to save money.
Real listing prices from Homegrown's catalog, pulled October 1, 2026 (listing prices, not sales):
Pricing below what your market will bear often doesn't win you more customers. It just reduces your margin and signals lower quality. If you're unsure how to set your prices, how to price food products for a farmers market walks through the right framework.
At Columbia Farmers Market in Missouri, 37% of shoppers said they shop weekly and 32% had been shopping there for 10 years or more in 2024. Repeat customers are the foundation of reliable farmers market income. Building your share of that crowd takes consistent attendance, but it transforms your revenue from unpredictable to reliable.
Here is the math on a regular base, as an example: a vendor with 30 loyal regulars who each spend $15 per week has a $450 baseline before a single new customer walks up. Your second season at a farmers market can outperform your first for this reason: the repeat customer base you built in year one is still there. At Columbia, 70% of vendors reported higher sales in 2024 than in 2023.
A vendor with complementary products at multiple price points increases their average transaction value because customers who come for one product often add another. The customer who comes for your sourdough might grab a jar of jam. The person buying cookies might add a spice blend. At a market where the average household spends about $16 across every booth (USDA 2019), a second item at your table can be the difference between an $8 sale and a $16 one.
A good starting point, as a rule of thumb, is 3 to 5 related products rather than a scattered collection of unrelated products. A baking-focused booth with cookies, brownies, bread, and jam tells a coherent story. A booth with cookies, hot sauce, candles, and soap confuses people about what you actually do.
Booth fees at the five farmers markets in our 2026 check ran from $10 to $90 a day, and most markets charge a flat daily or season fee rather than a cut of your sales. USDA's 2019 survey found that 6,389 of the estimated 8,140 markets charged vendors a fee. Of markets that charged, 74.4% used a flat rate and 12.4% took a percentage of sales (some used more than one method), and 35.2% of all markets had an annual membership or application fee.
Here are five real 2026 fee schedules plus North Carolina's statewide census, loaded October 1, 2026:
Swipe left to compare daily fees, season fees and extras.
| Market | Daily fee for a single space | Season option | Application, deposit and utility fees |
|---|---|---|---|
| Damascus Farmers Market, Virginia (Thursday evenings) | $10, cash only, if space is available | $250 for 25 weeks ($10 a week) | No other fee in the fee section |
| East Lansing Farmers Market, Michigan (Sundays) | $30 for part-time or daily vendors | $440 for 22 market days ($20 a day) | Electricity $5 a day or $60 a season |
| Tigard Farmers Market, Oregon (Sundays) | $45 a week for a 10 x 10 space | Same $45 a week, paid in full, split or weekly | $35 application fee; $45 deposit applied to your last market |
| St. Johns Farmers Market, Portland, Oregon (Saturdays) | $47 for a non-farmer food vendor, 10 x 10 | Pay per market date | No application fee in 2026 |
| Park City Farmers Market, Utah (Wednesdays) | $60 a day May to June, $90 a day July to September 1, for non-farm vendors; farmers $30 | $1,300 for the whole year | $120 application fee for all vendors |
| North Carolina markets, 2024 statewide census | Most common answer: $10 to $25 a day for a 10 x 10 | Some markets offer seasonal fees | Some charge membership fees |
Sources, loaded October 1, 2026: Damascus 2026 vendor agreement; City of East Lansing 2026 vendor application; Tigard 2026 vendor handbook; St. Johns Farmers Market "Become a Vendor" page (2026 season); Park City Farmers Market page titled "2026 Summer/Fall Season Rules & Regulations" (its schedule lines still show 2025 dates); North Carolina Farmers Market Network 2024 census. Late fees, fines and bounced-check fees on these pages are left out. Insurance, permits and tent costs can be extra.
What a booth fee does to your day depends on your sales. A $30 fee is about 16% of a $191 market day (Gallatin's average) but about 5% of a $582 day (USDA's national average). That is why the same fee can feel cheap to an established vendor and painful to a new one. Finding the break-even point for a farmers market booth walks through the full cost list.
Here's what annual sales look like at different levels of commitment when you multiply real per-day averages by a realistic number of market days. Each row uses a sourced sales figure and the same example costs (30% ingredients, 4% packaging, $40 booth fee per day), so you can see how the pieces fit.
Scroll sideways for the sales source and what is left at each level.
| Commitment Level | Markets/Year | Sales per market day (source) | Gross Revenue | Left after example costs |
|---|---|---|---|---|
| Casual/hobbyist | 20 | $191 (Gallatin, Tennessee, 2024) | $3,820 | $1,721 |
| Part-time serious | 30 | $449 (New Mexico survey, 2024) | $13,470 | $7,690 |
| Full-time single vendor | 52 (2 a week for 26 weeks) | $582 (USDA national, 2019) | $30,264 | $17,894 |
| Scaled operation | 67 | $716 (Columbia, Missouri: $47,980 a vendor over 67 dates, 2024) | $47,980 | $28,987 |
Left = gross × 0.66 (after 30% ingredients and 4% packaging) minus $40 × market days, before card processing, travel, insurance and taxes. Example: $13,470 × 0.66 = $8,890, minus $1,200 = $7,690. The per-day figures are averages across all vendor types at those markets. The Columbia row assumes a vendor at all 67 dates; the market's report gives sales per vendor, not per day.
These figures assume you're operating under a cottage food exemption or similar home production setup with minimal facility overhead. If you're renting a commercial kitchen, add that rent to your costs before you compare. And remember the median from the cottage food survey: $2,000 a year in sales. The table shows what is possible at each level, not what is typical.
Rather than relying on averages, estimate your own likely earnings with this four-step framework tailored to your specific situation. Expect your first estimate to be off; the point is to know which number to watch.
Example calculation: You plan to sell cookies and brownies at one busy farmers market per week during a 30-week season. Average transaction: $15. Estimated transactions: 35/day. Gross revenue: $525/day, or $15,750 for the season. That $525 a day is near USDA's national ratio of $582 and nearly three times the medium-market ratio of about $179, so it assumes a busy market and a booth people already stop at. Subtract ingredients at 30% ($4,725), booth fees at $40/day ($1,200), and packaging at 4% ($630). Estimated left after those costs: $9,195 for the year, before card processing, gas and taxes. Those inputs are an example; swap in your own.
Vendors who stay often sell more in later seasons, and one market's data shows it. At Columbia Farmers Market in Missouri, 70% of vendors reported an increase in sales in 2024 over 2023. The USDA and Wheaton College brief on the 2019 survey found that 68% of vendors at a market that year had returned from the season before, so about a third of the vendors at a market in a given year were new to that market.
In your first season, you'll probably:
The improvement in year two comes from three main sources:
Don't judge your farmers market business entirely based on year one results. Give it two seasons before drawing conclusions about long-term viability. Our first-year income report for a cottage food baker shows what that first season can look like on paper: a part-time Texas baker loses $145.93 in April, the month she buys her market gear, and keeps $9,116.16 by the end of February.
The biggest revenue problems for farmers market vendors are weather, short seasons, small crowds, fees and unsold perishable products. Each one shows up in the published data:
Farmers markets can be profitable for small vendors, but in the one survey that measured profit, the typical part-time seller's profit was modest. The only profit figure we found from a real survey is the Institute for Justice's: half of its 775 home food sellers made $500 or less in profit, on median sales of $2,000. The example math in this guide shows how that grows: $352 a day in the baseline example, $9,195 for a 30-week season in the estimate example.
What separates the profitable vendors from the break-even ones:
If you are deciding whether it is worth it, is selling at farmers markets profitable walks through a full year of costs.
Farm stands in New Mexico's 2024 survey averaged $120,254 in total sales, but they were open far more days than a weekly market. The New Mexico Farmers' Marketing Association surveyed 13 farm stands: total sales of $1,563,295.60, a range of $300 to $522,467 per stand, and an average of 131 days open (against 29 for the state's farmers markets). That works out to about $918 per farm stand day ($1,563,295.60 divided by 1,703 stand days).
Two cautions before you compare that to a market booth:
For a small vendor the practical answer is often both: a weekly market to meet customers and a home or farm pickup spot for the rest of the week. Farm stand vs farmers market compares the two in detail.
Some states cap how much a home food business can sell in a year, and the cap is on gross sales, not profit. We read three states' current rules on October 1, 2026, and here is what each one says:
Slide sideways to read each state's cap and its legal source.
| State | Yearly sales limit for a home food business | Where it comes from |
|---|---|---|
| California | Class A (direct sales only): $88,878. Class B (direct and indirect sales): $177,756. Effective January 1, 2026. | California Department of Public Health, "Cottage Food Operation Adjusted Gross Annual Sales Limit" sheet; Health and Safety Code 113758 sets $75,000 and $150,000 adjusted each year for inflation |
| Texas | $150,000 in annual gross income from cottage food | Texas DSHS cottage food page; SB 541, effective September 1, 2025, which also tells DSHS to adjust the figure each year for inflation |
| Florida | $250,000 in annual gross sales of cottage food products, counting all locations | Florida Statutes section 500.80(1)(a) and (b), 2026 edition |
Loaded October 1, 2026 from cdph.ca.gov, dshs.texas.gov and flsenate.gov. These are 3 of 50 states. Other states set different caps or none, and the allowed foods and selling places differ too.
To put those caps next to market income: California's 2026 Class A limit of $88,878 is about 153 market days at USDA's $582 average. A vendor doing one market a week will not get near it. A vendor doing three markets a week nearly year round, plus pre-orders, could: 153 market days is three markets a week for about 51 weeks. Three markets a week for a 26-week season comes to about $45,396 at $582 a day, roughly half the cap. Near the cap is the point where a commercial kitchen license starts to make sense. Our guides to cottage food law in California and cottage food revenue caps cover what happens if you hit one.
California's cap changes every January 1, and Texas's law tells its health department to adjust its figure each year for inflation. Check your own state's current rule before you plan around a number. We read California, Texas and Florida on October 1, 2026; verify your state's current rules with its health or agriculture department.
Homegrown vendors list an 8-ounce jar of jam or jelly at a median of $10 across listings ($9 across the 6 vendors), and granola at about 85 cents an ounce (the median across 8 vendors). These are listing prices from our own catalog, not sales, so read them as "what vendors ask," not "what vendors earn."
In a pull of the Homegrown catalog on October 1, 2026 (2,748 products from 308 vendors), we searched product names and descriptions for jam, jelly, preserves and marmalade, read every match by hand, then read each matching vendor's full product list. 35 listings from 6 vendors sold jam or jelly in a stated 8-ounce jar, at $6.50 to $12, with a median of $10 across listings and $9 across the 6 vendors. Apple butter, fruit coulis and jars with no stated size were left out. For granola we did the same search and kept loose granola with a stated bag weight: 17 listings from 8 vendors, at 60 cents to $1.67 an ounce. Granola bars and bags with no weight were left out.
How to use those numbers at your table:
Pre-orders and local pickup orders bring in sales with no extra booth fee and no extra market day. One of the biggest income gaps for market-only vendors is the days between farmers markets: you have customers who love your products, but you're only available for a few hours on Saturday.
Pre-orders close that gap. Customers place an order during the week, you add it to your production plan, and they pick it up at the farmers market or at your home at a scheduled time. Pre-orders are efficient because you're producing to known demand rather than guessing: less waste, less uncertainty, and more effective batch production.
Here is the math, as an example: if 10 regulars each pre-order $20 a week, that's $200 a week in sales you would not otherwise have. Over a 30-week season that is $6,000, with no extra booth fee because they pick up at your existing table or your door.
Benefits of adding pre-orders to your farmers market business:
The customers most likely to pre-order are the regulars who already buy from you every week. Ask them first, since ordering ahead means they don't miss out on what they came for.
You just did the math on farmers market income: ingredient costs, booth fees, transactions per day. Platform costs work the same way: they either eat into your margins or they don't. Here is what each option charges on a $20 pre-order, checked on each company's own pricing page on October 1, 2026:
Drag the table to see the full fee stack for every platform.
| Platform | Monthly plan | Trial | Platform or transaction fee | Card processing | Customer pays on a $20 order | Vendor pays on a $20 order | Vendor pays in a month of 50 orders at $20 |
|---|---|---|---|---|---|---|---|
| Homegrown | $10 billed annually ($12.50 billed monthly) | 7 days, no charge until day 8 | $0, 0% commission | 2.9% + $0.30, paid by the vendor | $20.00 | $0.88 plus the plan | $54.00 |
| Etsy | $0 (Etsy Plus is optional at $10) | None; a one-time set-up fee may apply | 6.5% transaction fee plus $0.20 listing fee per listing, renewed after each sale | 3% + $0.25 | $20.00 | $2.35 | $117.50 |
| Shopify Basic | $29 billed yearly ($39 billed monthly) | 3 days, then $1 a month for 3 months | None with Shopify Payments; third-party transaction fees may apply with another provider | 2.9% + 30¢ online | $20.00 | $0.88 plus the plan | $73.00 |
| Square Free plan | $0 | Not needed on the $0 plan | None | 3.3% + 30¢ online (2.6% + 15¢ in person) | $20.00 | $0.96 online | $48.00 |
Checked October 1, 2026 on findhomegrown.com/signup, Etsy's Fees and Payments Policy and payment processing fee table, shopify.com/pricing and squareup.com/us/en/pricing. Monthly totals use annual billing where offered. Etsy's Offsite Ads fee (15% on orders it attributes to its ads, for shops under $10,000 a year that have not opted out) is not included. Card processing is figured on the $20 price.
Text messages and Instagram DMs cost nothing upfront, but they cost you time. Tracking who ordered what, chasing payment, and confirming pickups across 15 different message threads is unpaid work that cuts into your effective hourly rate, and a missed message can be a lost order.
Etsy works out to $2.35 on a $20 order: a 6.5% transaction fee, a $0.20 listing fee and 3% + $0.25 processing. On $200 a week in pre-orders (10 orders at $20), that's $23.50 a week, or $1,222 over a 52-week year. You're also competing for visibility with sellers who ship nationwide, which is what Etsy is built for.
Shopify Basic is $29 a month billed yearly ($348 a year) or $39 billed monthly ($468 a year), plus 2.9% + 30¢ per online card payment. It is built mainly for businesses that ship; local pickup is available, but its $29 monthly plan is the highest plan fee here, though Etsy's per-order fees cost more in total at 50 orders a month.
Square's Free plan costs $0 a month, but online card payments cost 3.3% + 30¢, which is $0.96 on a $20 order.
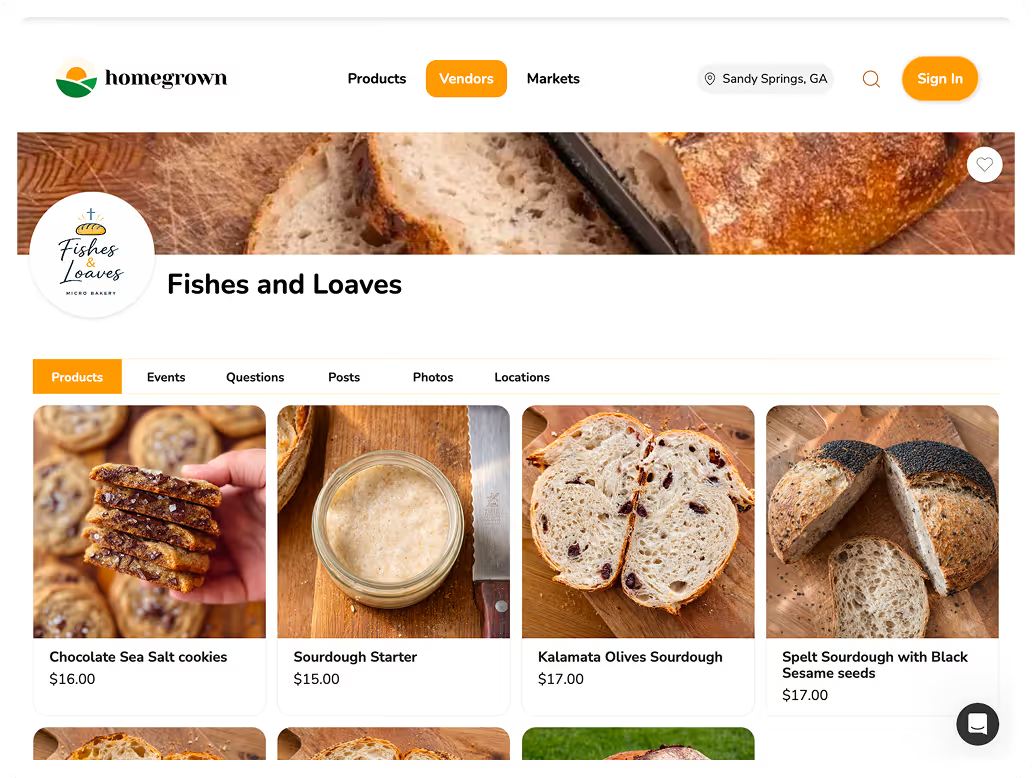
Homegrown costs $10 per month billed annually ($12.50 billed monthly) with no percentage fees beyond standard payment processing (2.9% + $0.30, paid by the vendor), and it is designed for how market vendors operate. You list your products, add the farmers markets where you sell as pickup locations, set your pickup days and how much lead time you need before each pickup, and collect payment when customers order. Sales tax is calculated and filed for you, a built-in QR code generator puts your storefront link on your booth sign, and your storefront is listed on the Homegrown marketplace, though you should plan on most orders coming from regulars you send to your own link.
On the same $200 a week, Homegrown works out to $577.60 a year ($120 for the plan plus $0.88 on each of 520 orders), against $1,222 on Etsy, $805.60 on Shopify Basic billed yearly and $499.20 on Square's Free plan for online card payments.
Homegrown is built for local pickup and local delivery; it doesn't ship orders. There is no drops or countdown release feature. Customers create a Homegrown account to place their first order. It's built for vendors selling a set product menu on a regular schedule to local buyers, which is exactly the pre-order model that turns one market day into a week of sales.
Home food sellers in the Institute for Justice survey put in about 15 hours a week on average, so farmers market income is not passive. It requires real time investment, and the income numbers don't mean much without understanding the work behind them.
A typical week includes:
Here is the hourly math as an example: at the baseline example's $352 left per market day after ingredients and the booth fee, with 12 to 18 hours of total work, your effective hourly rate works out to roughly $20 to $29 per hour. For the median seller in the cottage food survey, who kept $500 for the whole year, the hourly rate is far lower. Which one you get depends on the market you pick, your prices, and how many customers come back.
To move your own number, treat your booth like a real business. Track what sells and what doesn't. Test new products and retire underperformers. Invest in better displays and packaging. Build relationships with regulars and make your booth a destination.
The gap between a $96 vendor day and a $570 one in USDA's data is mostly the market, not talent or luck. Within a market, better products, better pricing, better presentation and a base of regulars that took time to build are what move your own number. USDA's size averages point to a roughly sixfold gap in sales per vendor between small and extra-large markets, so where you sell is one of the biggest choices you make.
Want to earn more than one market day allows? The easiest way to take local orders and get paid is an online storefront: see the best platform to sell food from home, or set up a Homegrown storefront in about 15 minutes ($10/mo billed annually, 0% commission, 2.9% + $0.30 card processing).
Market managers in USDA's 2019 survey reported $14,547 in sales per market day and 25 vendors on a peak day, which is about $582 per vendor. Dividing USDA's size-group averages gives roughly $96 a vendor at small markets and $179 at medium ones, a rough figure because the brief ranks markets by vendors and by sales separately. The typical vendor likely makes less than the average, because a few big sellers pull averages up; the cottage food survey's median was $2,000 a year in sales. Those are gross sales; ingredients, packaging, booth fees and card processing come out before you keep anything.
It is possible but rare. The one survey of home food sellers suggests it is not the norm (its median was $2,000 a year in sales), and it usually takes several market days a week. Two markets a week for 26 weeks at USDA's $582 average is $30,264 in sales, or about $17,894 after example costs, and that is still before card processing, travel, insurance and taxes. Columbia Farmers Market in Missouri averaged $47,980 in sales per vendor across 67 dates in 2024, which shows what a large, busy market can carry.
No survey we found tracks vendors from their first season forward, so plan on at least two seasons. At Columbia Farmers Market, 70% of vendors reported higher sales in 2024 than in 2023, and USDA found 68% of 2019 vendors had returned from the year before. The first season is the learning curve (pricing, product mix, volume planning); the second benefits from repeat customers and refined operations.
Products with high margins, fast production, and impulse-buy pricing tend to earn more per market day. Shelf-stable products like granola, jam and spice blends lose less to unsold stock because they keep longer than fresh pastries. On Homegrown, 8-ounce jam listed at a $10 median and granola at about 85 cents an ounce on October 1, 2026. As a rule of thumb, a complementary lineup of 3 to 5 products at different price points raises your revenue per customer.
Booth fees matter most on slow days. For 2026, the five market fee schedules in this guide ran $10 to $90 a day, and North Carolina's 2024 census found $10 to $25 a day for a 10 x 10 the most common answer. A $30 fee is about 16% of a $191 day but about 5% of a $582 day. On a $582 day, 30% ingredient costs come to about $175, far more than a $30 fee.
Start with what you own and spend on the things customers notice first: a clean tablecloth, crates or risers for height, printed price cards, and a name sign. Better booth presentation helps sales, but every dollar spent on fixtures has to be earned back at your margin. Read the market's rules before you buy anything: East Lansing's 2026 rules call for at least 40 pounds of weight on each tent leg, and Tigard's call for a 25-pound weight on each leg with a $100 weekly fine for improper weights.
It can be, if you pick the right market and price for profit. In the example math, $352 left per market day after ingredients and the booth fee, with 12-18 hours total work, is about $20 to $29 per hour. The cottage food survey's median of $500 a year in profit shows that the typical seller in that survey earned far less, so treat farmers market selling as worth it when your own numbers say so, not because of an average.
More on the numbers behind a farmers market booth: